|
Course : Multidimensional Data Analysis (MDA)
Participants : BSc Mathematics and Data Science Institution: Sorbonne University Instructor : Dr. Tanujit Chakraborty Timeline : January 2023 to April 2023 Total Teaching : 45 Sessions Email: [email protected] |
|
Course Objectives:
Predictive models are very essential tools that is used daily in corporate practices and decision making. The aim of this course is to provide students with a general account of the set of statistical methods used for analyzing multivariate data. In particular, the course covers the statistical tools which are necessary to extract relevant information from any dataset. Several standard techniques are presented like univariate and multivariate regression, principal components analysis, factor and multifactor analysis. The students are expected to understand how these methods work, how to apply them on a new dataset and to interpret the outputs of the different algorithms.
Course Syllabus: Topics to be covered in this course include
1. Introduction to MDA
2. Recap of Descriptive Statistics
3. Recap of Probability and Sampling Distributions
4. Basics of Statistical Inference and ANOVA
5. Basics of R and RStudio
6. Relationship Analysis
7. Multiple Linear Regression
8. Model Selection
9. Multicollinearity
10. Shrinkage Methods: Ridge, LASSO, and Elastic Net
11. Model Adequacy Checking
12. Nonlinear Regression Analysis
13. Transformations and Generalized Linear Models
14. Autoregression Analysis
15. Logistic Regression
16. Singular Value Decomposition
17. Principal Component Analysis
18. Factor Analysis and Market Basket Analysis
19. Linear Discriminant Analysis and QDA
20. Implementations in RStudio
Evaluation Components:
The evaluation components for the Multivariate Data Analytics (MDA) course will be as follows:
1) Kaggle Competition - 20% 2) Mid Term Test - 20% 3) Project Work - 20% 4) End Term Test - 40%.
1) Kaggle Competition - 20% 2) Mid Term Test - 20% 3) Project Work - 20% 4) End Term Test - 40%.
Textbooks and References:
• Friedman J, Hastie T, Tibshirani R. (2017). The Elements of Statistical Learning. Springer series in statistics. (Read Online)
• Gareth, J, Witten D, Hastie T, and Tibshirani R. (2021). An introduction to statistical learning: with applications in R. Springer. (Read Online)
• Rencher, A.C. and Christensen, W.F. (2012). Methods of Multivariate Analysis. 3rd Edition. An Introduction to Stochastic Modeling. Wiley.
• Wickham, H. and Garrett, G. (2016) R for Data Science. O'Reilly Media, Inc. (Read Online)
• Healy, Kieran. Data visualization: a practical introduction. (2018). Princeton University Press. (Read Online)
Some Interesting Papers For Reading :
• The Two Cultures - Statistical Modeling: The Two Cultures (2001)
• Data Science - 50 Years of Data Science (2017)
• Future - The future of statistics and data science (2018)
• Statistics Vs Machine Learning - Prediction, Estimation, and Attribution (2020)
• Statistics - What are the most important statistical ideas of the past 50 years? (2021)
• Data Science - 50 Years of Data Science (2017)
• Future - The future of statistics and data science (2018)
• Statistics Vs Machine Learning - Prediction, Estimation, and Attribution (2020)
• Statistics - What are the most important statistical ideas of the past 50 years? (2021)
|
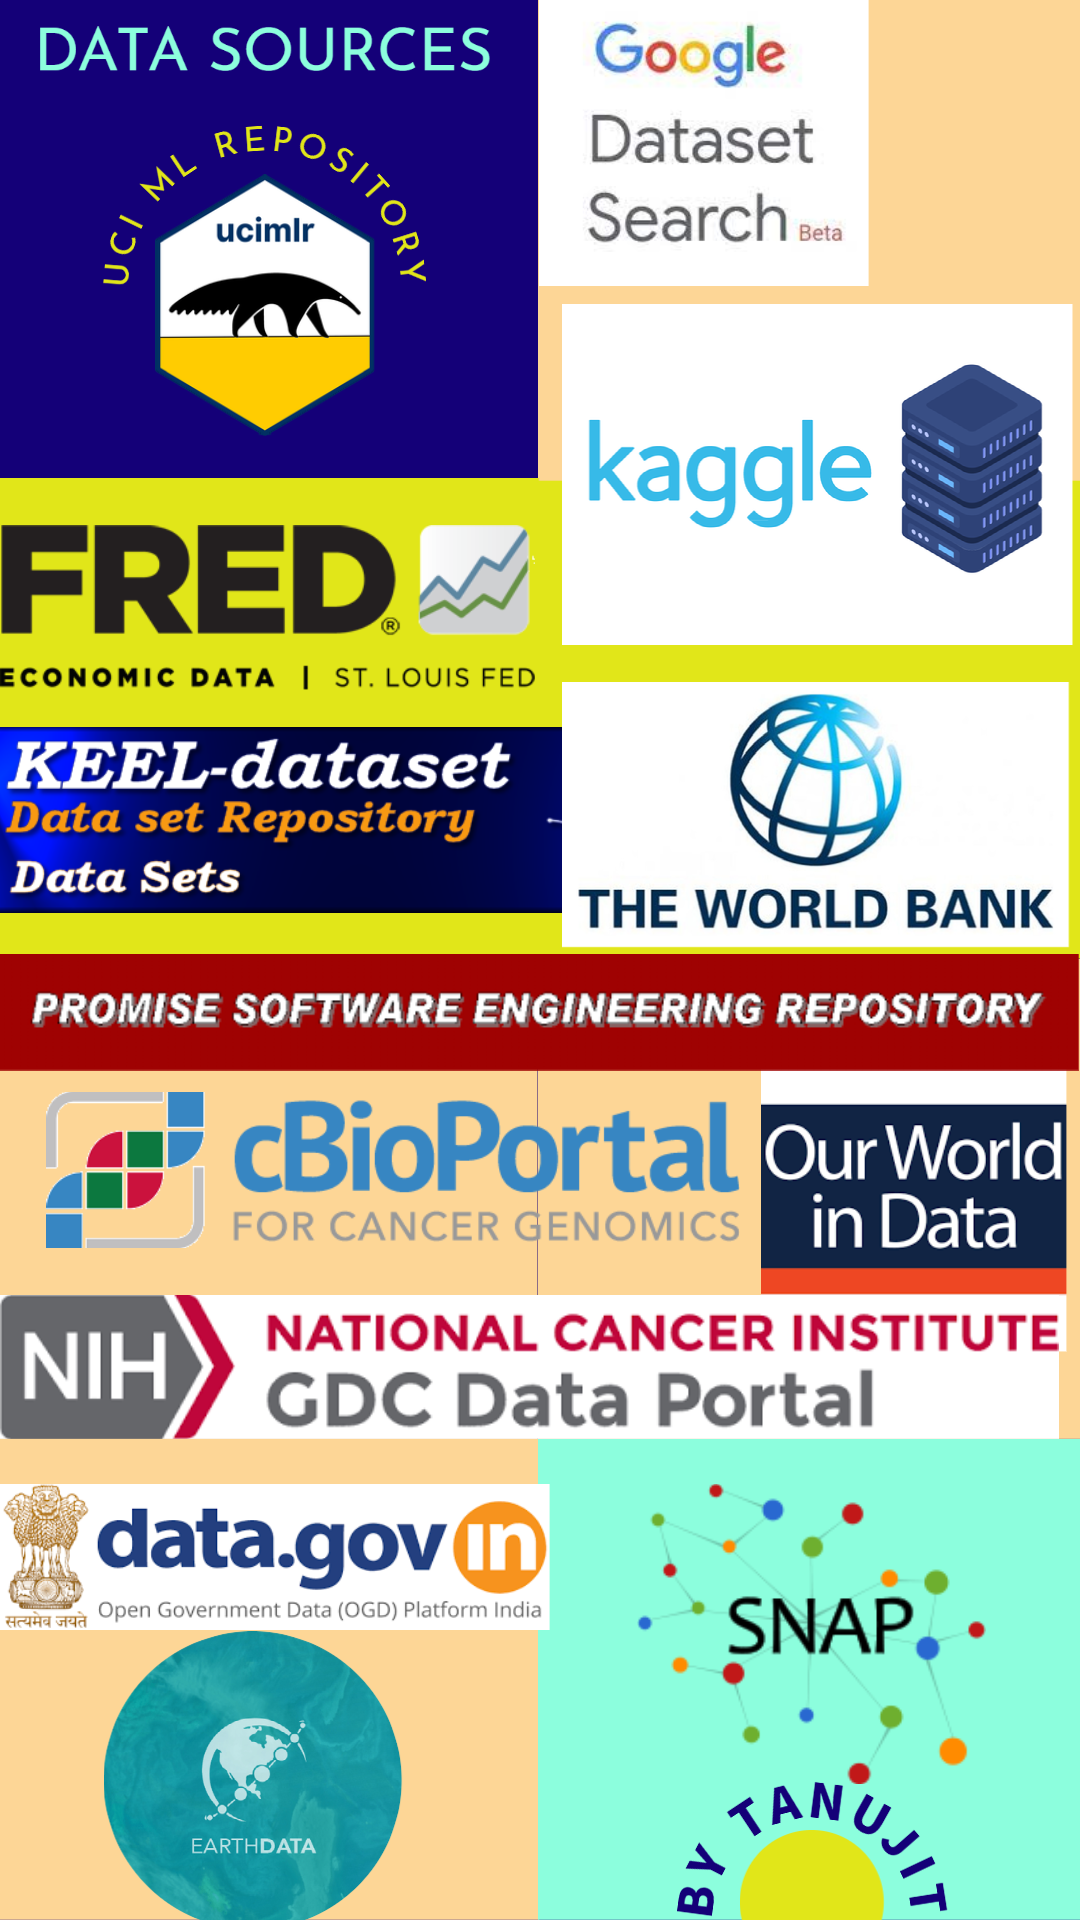
Datasets :
|
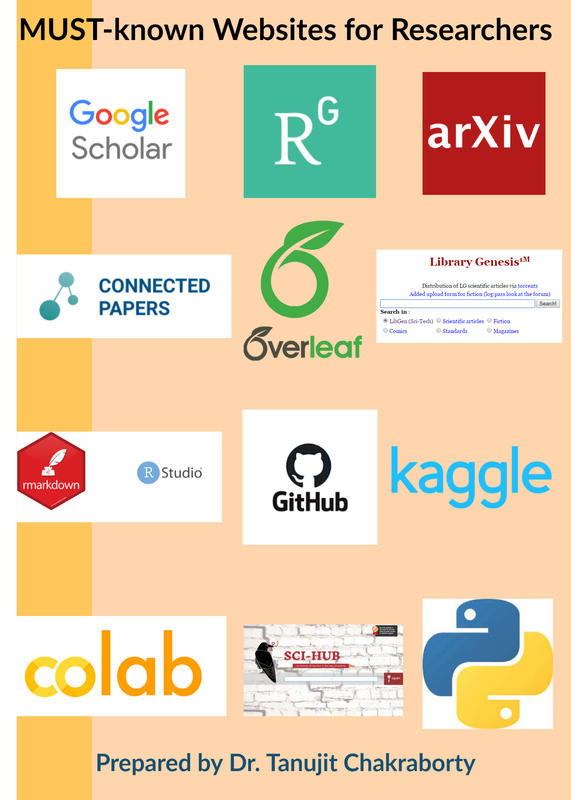
Important Links :
|
Class notes, Tutorials, and Lab Sessions:
This is a 12 weeks course for L2 Mathematics. All the data and codes used during teaching will be made available in this link: github.com/tanujit123/MATH-260
This is a 12 weeks course for L2 Mathematics. All the data and codes used during teaching will be made available in this link: github.com/tanujit123/MATH-260
|
Week 1 : Topics:
|
|
| ||||||||||||
|
Week 2 : Topics:
|
| ||||||||||||||
|
Week 3 : Topics
|
|
| ||||||||||||||||
Week 4 : Topics
- Theory of Estimation
- Testing of Hypothesis
- ANOVA
- Distribution Fitting using R : Exponential
- Testing and ANOVA using R
- Tutorial Worksheet - 3
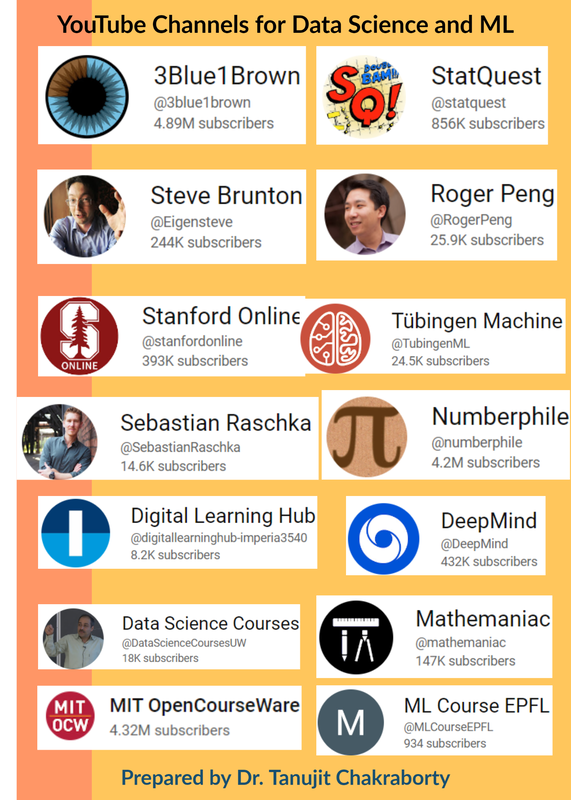
MUST-known Links:
Please find very useful YouTube Channels on DS/Statistics/ML, Important websites and software, and data resource names below: